The Fix We’re In For 2015: The State of Minnesota’s Bridges
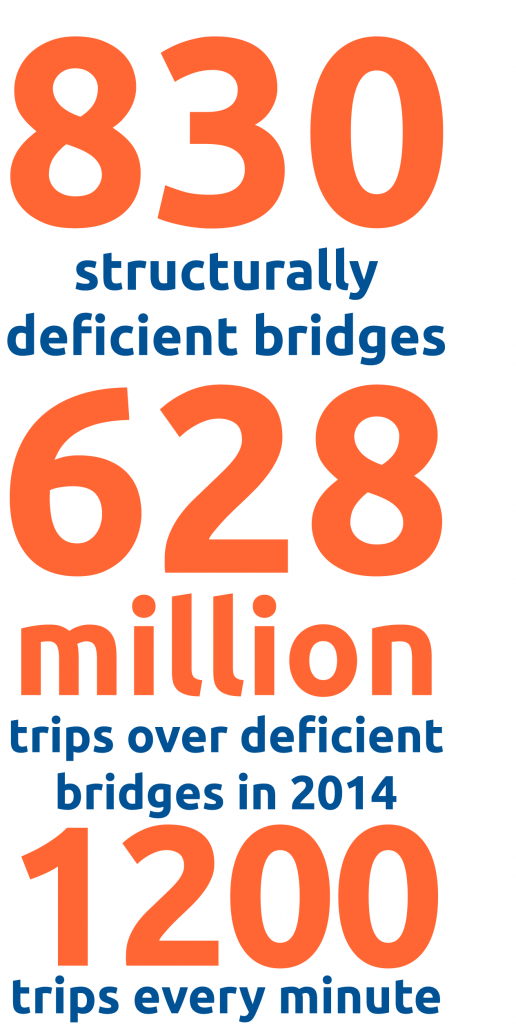
Every day, millions of people from all walks of life in Minnesota cities, towns and rural areas travel over one of the state’s 12,961 bridges that carry vehicle traffic. These bridges carry commuters through and within our cities, move people from town to town, help farmers bring their goods to market, and get freight from A to B each and every day. But today, far too many of these bridges are rated structurally deficient — bridges in urgent need of repair or replacement. Minnesota today has 830 structurally deficient bridges, representing 6.4 percent of the state’s 12,961 bridges. Those 830 bridges represent a looming crisis for the state.
The average age of these sub-par bridges is 66 years — well over the typical design life of 50 years and nearly double the average age of all Minnesota bridges (35 years old). More than one in ten Minnesota bridges were built before 1948 — which means more than 1,300 bridges are older than the Korean War and creation of Medicare.
Minnesota drivers collectively took close to 628 million trips over deficient bridges in 2014. That’s more than 1.7 million trips per day or almost 1,200 trips every minute taken over deficient Minnesota bridges in 2014.
Minnesotans and Minnesota businesses rely on bridges each day that are subject to closure or weight restriction if increased maintenance and reconstruction are not undertaken — a potentially crippling impact on personal travel and freight movement. And as the location of the most deadly bridge collapse in recent American history, Minnesotans know the impacts better than most.
Minnesota counties bridge summary data
| County | Percent structurally deficient | Total bridges | Number deficient | Avg. age of deficient bridges | Percent of deficient bridges locally-owned | Total built before 1948 |
|---|---|---|---|---|---|---|
| Lincoln County | 23.0% | 100 | 23 | 66 | 100.0% | 31 |
| Pipestone County | 19.0% | 168 | 32 | 58 | 100.0% | 35 |
| Redwood County | 16.0% | 188 | 30 | 62 | 96.7% | 25 |
| Mower County | 15.9% | 328 | 52 | 78 | 96.2% | 66 |
| Carver County | 15.8% | 114 | 18 | 65 | 100.0% | 14 |
| St. Louis County | 15.7% | 648 | 102 | 67 | 94.1% | 112 |
| Renville County | 15.4% | 130 | 20 | 61 | 100.0% | 8 |
| Mahnomen County | 14.6% | 41 | 6 | 62 | 100.0% | 2 |
| Chippewa County | 13.6% | 118 | 16 | 57 | 81.3% | 9 |
| Cook County | 11.3% | 53 | 6 | 47 | 50.0% | 7 |
| Fillmore County | 11.2% | 329 | 37 | 72 | 100.0% | 74 |
| Sherburne County | 11.1% | 45 | 5 | 68 | 80.0% | 5 |
| Sibley County | 10.0% | 100 | 10 | 52 | 100.0% | 5 |
| Martin County | 9.3% | 162 | 15 | 85 | 100.0% | 24 |
| Carlton County | 8.5% | 129 | 11 | 68 | 72.7% | 17 |
| Waseca County | 8.3% | 84 | 7 | 71 | 100.0% | 10 |
| Rock County | 8.0% | 249 | 20 | 68 | 95.0% | 22 |
| Houston County | 7.9% | 164 | 13 | 82 | 100.0% | 21 |
| Swift County | 7.9% | 89 | 7 | 66 | 71.4% | 3 |
| Douglas County | 7.7% | 39 | 3 | 49 | 0.0% | 0 |
| Wilkin County | 7.6% | 197 | 15 | 68 | 86.7% | 17 |
| Jackson County | 7.4% | 189 | 14 | 67 | 100.0% | 18 |
| Chisago County | 7.3% | 55 | 4 | 50 | 100.0% | 5 |
| Aitkin County | 7.1% | 99 | 7 | 53 | 57.1% | 9 |
| Lake County | 7.0% | 86 | 6 | 61 | 33.3% | 6 |
| Hubbard County | 6.8% | 44 | 3 | 50 | 100.0% | 4 |
| Otter Tail County | 6.8% | 147 | 10 | 54 | 100.0% | 9 |
| Itasca County | 6.7% | 163 | 11 | 63 | 63.6% | 16 |
| Faribault County | 6.6% | 213 | 14 | 55 | 100.0% | 11 |
| Cass County | 6.4% | 78 | 5 | 60 | 100.0% | 7 |
| Nicollet County | 6.3% | 48 | 3 | 61 | 0.0% | 3 |
| Todd County | 6.1% | 131 | 8 | 72 | 100.0% | 14 |
| Norman County | 6.0% | 149 | 9 | 64 | 100.0% | 13 |
| Clay County | 6.0% | 217 | 13 | 73 | 84.6% | 17 |
| Becker County | 5.9% | 51 | 3 | 55 | 100.0% | 4 |
| Ramsey County | 5.8% | 311 | 18 | 60 | 55.6% | 23 |
| Roseau County | 5.7% | 141 | 8 | 65 | 100.0% | 8 |
| Hennepin County | 5.5% | 858 | 47 | 72 | 80.9% | 93 |
| Winona County | 5.4% | 223 | 12 | 65 | 83.3% | 23 |
| Dodge County | 5.3% | 169 | 9 | 70 | 100.0% | 26 |
| Murray County | 4.7% | 129 | 6 | 54 | 100.0% | 14 |
| Steele County | 4.5% | 132 | 6 | 48 | 66.7% | 7 |
| Kandiyohi County | 4.5% | 88 | 4 | 56 | 100.0% | 10 |
| Le Sueur County | 4.5% | 67 | 3 | 65 | 100.0% | 15 |
| Kittson County | 4.5% | 157 | 7 | 56 | 71.4% | 11 |
| Traverse County | 4.3% | 116 | 5 | 55 | 100.0% | 7 |
| Freeborn County | 4.3% | 140 | 6 | 60 | 83.3% | 10 |
| Lyon County | 4.3% | 234 | 10 | 60 | 100.0% | 25 |
| Morrison County | 4.3% | 164 | 7 | 63 | 100.0% | 17 |
| Lac qui Parle County | 4.2% | 167 | 7 | 62 | 100.0% | 13 |
| Yellow Medicine County | 4.1% | 222 | 9 | 78 | 100.0% | 25 |
| Washington County | 4.0% | 101 | 4 | 80 | 50.0% | 6 |
| Marshall County | 3.8% | 213 | 8 | 65 | 100.0% | 16 |
| Blue Earth County | 3.6% | 192 | 7 | 65 | 85.7% | 20 |
| Goodhue County | 3.5% | 314 | 11 | 86 | 90.9% | 70 |
| Wabasha County | 3.5% | 144 | 5 | 72 | 80.0% | 24 |
| Red Lake County | 3.4% | 59 | 2 | 61 | 50.0% | 5 |
| Grant County | 3.3% | 30 | 1 | 62 | 100.0% | 3 |
| Meeker County | 3.3% | 61 | 2 | 88 | 100.0% | 3 |
| Beltrami County | 3.3% | 92 | 3 | 61 | 33.3% | 3 |
| Koochiching County | 3.3% | 92 | 3 | 43 | 100.0% | 4 |
| Pine County | 3.1% | 163 | 5 | 61 | 60.0% | 11 |
| Mille Lacs County | 2.9% | 105 | 3 | 45 | 100.0% | 0 |
| Wadena County | 2.7% | 73 | 2 | 52 | 100.0% | 0 |
| Brown County | 2.7% | 110 | 3 | 71 | 66.7% | 10 |
| Cottonwood County | 2.7% | 147 | 4 | 74 | 100.0% | 25 |
| Polk County | 2.7% | 258 | 7 | 73 | 71.4% | 12 |
| McLeod County | 2.7% | 75 | 2 | 48 | 100.0% | 1 |
| Benton County | 2.6% | 115 | 3 | 57 | 100.0% | 11 |
| Olmsted County | 2.6% | 346 | 9 | 61 | 100.0% | 37 |
| Stearns County | 2.2% | 223 | 5 | 57 | 100.0% | 26 |
| Stevens County | 2.2% | 45 | 1 | 61 | 100.0% | 6 |
| Rice County | 2.2% | 135 | 3 | 55 | 100.0% | 8 |
| Pope County | 2.2% | 45 | 1 | 15 | 100.0% | 3 |
| Anoka County | 2.1% | 140 | 3 | 53 | 100.0% | 3 |
| Clearwater County | 2.1% | 48 | 1 | 86 | 100.0% | 6 |
| Pennington County | 2.1% | 48 | 1 | 88 | 100.0% | 3 |
| Watonwan County | 1.8% | 163 | 3 | 49 | 100.0% | 25 |
| Crow Wing County | 1.5% | 67 | 1 | 105 | 100.0% | 6 |
| Kanabec County | 1.3% | 79 | 1 | 47 | 100.0% | 4 |
| Scott County | 1.0% | 102 | 1 | 38 | 100.0% | 4 |
| Nobles County | 0.7% | 296 | 2 | 94 | 100.0% | 31 |
| Dakota County | 0.4% | 235 | 1 | 104 | 100.0% | 16 |
| Isanti County | 0.0% | 36 | 0 | N/A | N/A | 0 |
| Wright County | 0.0% | 70 | 0 | N/A | N/A | 5 |
| Big Stone County | 0.0% | 15 | 0 | N/A | N/A | 5 |
| Lake of the Woods County | 0.0% | 61 | 0 | N/A | N/A | 3 |