


The looming fiscal disaster for transportation
America is at a crucial decision point for transportation. The nation’s transportation trust fund is facing a crisis. The gas tax that has sustained the federal transportation program since the middle of the last century is no longer keeping up with investment needs. Starting this fall, every dollar of gas tax revenues collected will be needed to cover the federal share of projects already promised to states, regions, and transit agencies, according to the Congressional Budget Office.
Unless Congress adds new revenue to the trust fund, the federal government will be unable to commit to funding new projects, depriving states and localities of resources critical to maintaining and improving the infrastructure that makes our economy possible.
At the same time, Congress has an opportunity to save and reinvigorate our most important infrastructure program in order to boost today’s economy and ensure future prosperity. The federal law that sets national transportation policy and investment levels – known as MAP-21 –expires on October 1. As Congress reconsiders this vital program, business and elected leaders across the country are calling on the representatives not only to save the transportation trust fund, but also to refocus federal transportation policy on locally-driven, innovative transportation solutions.
This report examines the impact of Congressional inaction on the transportation needs of each state and metropolitan area, a potential loss of nearly $47 billion that would jeopardize the nation’s future economic growth. It demonstrates why Congress must act – and soon – to avoid depriving states and communities of the critical resources needed to provide the safe and reliable transportation networks that allow people to thrive and businesses to succeed.
Federal dollars as a percentage of state (capital) transportation budgets (2001-2012)
| State | Federal share |
|---|---|
| Alabama | 67.5% |
| Alaska | 93.3% |
| Arizona | 49.9% |
| Arkansas | 63.0% |
| California | 48.1% |
| Colorado | 52.3% |
| Connecticut | 71.3% |
| Delaware | 42.5% |
| Dist. of Col. | 52.1% |
| Florida | 39.3% |
| Georgia | 60.4% |
| Hawaii | 70.5% |
| Idaho | 68.0% |
| Illinois | 41.6% |
| Indiana | 55.2% |
| Iowa | 58.8% |
| Kansas | 48.4% |
| Kentucky | 44.7% |
| Louisiana | 50.4% |
| Maine | 56.4% |
| Maryland | 49.4% |
| Massachusetts | 38.0% |
| Michigan | 42.3% |
| Minnesota | 60.9% |
| Mississippi | 64.8% |
| Missouri | 63.2% |
| Montana | 88.0% |
| Nebraska | 48.2% |
| Nevada | 52.9% |
| New Hampshire | 64.7% |
| New Jersey | 35.0% |
| New Mexico | 71.7% |
| New York | 44.1% |
| North Carolina | 48.3% |
| North Dakota | 77.9% |
| Ohio | 59.0% |
| Oklahoma | 61.6% |
| Oregon | 54.5% |
| Pennsylvania | 47.4% |
| Rhode Island | 98.1% |
| South Carolina | 79.5% |
| South Dakota | 72.0% |
| Tennessee | 62.9% |
| Texas | 43.8% |
| Utah | 34.6% |
| Vermont | 84.2% |
| Virginia | 58.6% |
| Washington | 36.2% |
| West Virginia | 60.8% |
| Wisconsin | 54.4% |
| Wyoming | 72.7% |
Notes: Compares federal highway funding provided to states with state capital outlays for highways, and federal transit capital funding provided to states and urbanized areas with transit capital expenditures.
Sources:
Highway Receipts:
FHWA: Highway Statistics Series 2001-2012, Table SF-1, “Revenues Used for Highways by States” and SF-2, “Disbursements by States for Highways”
Transit Funds Applied:
FTA: “National Transit Database TS1.3 – Capital Funding Time-Series, 2001 to 2012.”
How much federal highway and transit funding states stand to lose in FY 2015
| State | Total Funding (dollars) |
|---|---|
| Alabama | 795,940,522 |
| Alaska | 530,948,095 |
| Arizona | 825,732,143 |
| Arkansas | 537,519,402 |
| California | 4,874,210,701 |
| Colorado | 636,443,044 |
| Connecticut | 654,278,090 |
| Delaware | 193,071,689 |
| Dist. of Col. | 300,280,023 |
| Florida | 2,210,614,868 |
| Georgia | 1,439,920,626 |
| Hawaii | 210,909,824 |
| Idaho | 307,943,173 |
| Illinois | 1,917,564,166 |
| Indiana | 1,036,206,363 |
| Iowa | 526,271,553 |
| Kansas | 406,157,492 |
| Kentucky | 696,759,307 |
| Louisiana | 748,956,978 |
| Maine | 212,291,022 |
| Maryland | 823,464,184 |
| Massachusetts | 956,611,330 |
| Michigan | 1,166,560,552 |
| Minnesota | 739,788,429 |
| Mississippi | 498,547,291 |
| Missouri | 1,017,454,027 |
| Montana | 421,688,246 |
| Nebraska | 304,996,749 |
| Nevada | 409,378,648 |
| New Hampshire | 181,282,406 |
| New Jersey | 1,570,130,769 |
| New Mexico | 405,437,832 |
| New York | 2,999,147,247 |
| North Carolina | 1,135,237,623 |
| North Dakota | 259,623,174 |
| Ohio | 1,479,609,333 |
| Oklahoma | 664,190,048 |
| Oregon | 585,919,232 |
| Pennsylvania | 1,979,652,555 |
| Rhode Island | 231,998,035 |
| South Carolina | 703,867,293 |
| South Dakota | 293,245,716 |
| Tennessee | 912,390,805 |
| Texas | 3,787,141,049 |
| Utah | 406,651,187 |
| Vermont | 208,123,748 |
| Virginia | 1,196,356,996 |
| Washington | 907,772,105 |
| West Virginia | 456,828,352 |
| Wisconsin | 826,022,133 |
| Wyoming | 262,121,298 |
Note: This table shows the contract authority that would be available if the total authorization in FY2015 remained at the FY2014 level, with no changes in distribution formulas.
Sources: FHWA: Revised Apportionment of Federal-aid Highway Funds for FY 2014, Table 1 (http://www.fhwa.dot.gov/legsregs/directives/notices/n4510770.cfm);
FTA: FTA Allocations for Formula and Discretionary Programs by State FY 1998-2014 (Excel) (http://www.fta.dot.gov/documents/FTA_Apportionments_for_Formula_and_Discretionary_Programs_by_State_FY_1998-2014.xls)
How much federal highway and transit funding urban areas states stand to lose in FY 2015
| Urbanized Area | State | Total (dollars) |
|---|---|---|
| Anchorage | AK | 56,819,364 |
| Birmingham | AL | 25,319,929 |
| Huntsville | AL | 9,177,857 |
| Mobile | AL | 11,100,862 |
| Montgomery | AL | 8,998,969 |
| Little Rock | AR | 16,478,311 |
| Fayetteville-Springdale-Rogers | AR-MO | 10,193,489 |
| Phoenix-Mesa | AZ | 115,459,367 |
| Tucson | AZ | 28,994,739 |
| Antioch | CA | 14,616,612 |
| Bakersfield | CA | 15,098,548 |
| Concord, CA | CA | 56,467,224 |
| Fresno | CA | 21,190,815 |
| Indio-Cathedral City | CA | 9,471,196 |
| Lancaster-Palmdale | CA | 19,329,048 |
| Los Angeles-Long Beach-Anaheim | CA | 569,165,114 |
| Mission Viejo-Lake Forest-San Clemente | CA | 22,108,474 |
| Modesto | CA | 10,187,086 |
| Murrieta-Temecula-Menifee | CA | 10,767,276 |
| Oxnard | CA | 18,173,696 |
| Riverside-San Bernardino | CA | 70,050,262 |
| Sacramento | CA | 59,451,807 |
| San Diego | CA | 139,495,771 |
| San Francisco-Oakland | CA | 292,964,961 |
| San Jose | CA | 85,120,892 |
| Santa Clarita | CA | 10,054,084 |
| Santa Rosa | CA | 8,799,456 |
| Stockton | CA | 16,062,217 |
| Thousand Oaks | CA | 8,553,912 |
| Victorville-Hesperia | CA | 8,171,158 |
| Visalia | CA | 7,196,371 |
| Colorado Springs | CO | 16,153,127 |
| Denver-Aurora | CO | 96,447,083 |
| Fort Collins | CO | 7,324,846 |
| Hartford | CT | 40,372,423 |
| New Haven | CT | 32,957,455 |
| Bridgeport-Stamford | CT-NY | 94,492,510 |
| Norwich-New London | CT-RI | 9,009,723 |
| Washington, DC | DC-MD-VA | 424,309,910 |
| Bonita Springs | FL | 8,775,634 |
| Cape Coral | FL | 14,333,101 |
| Jacksonville | FL | 31,570,166 |
| Kissimmee | FL | 10,031,204 |
| Lakeland | FL | 6,942,984 |
| Miami | FL | 238,630,565 |
| Orlando | FL | 46,712,576 |
| Palm Bay-Melbourne | FL | 13,164,181 |
| Palm Coast-Daytona Beach-Port Orange | FL | 10,613,170 |
| Port St. Lucie | FL | 9,225,979 |
| Sarasota-Bradenton (Manatee Cnty) | FL | 18,730,571 |
| Tallahassee | FL | 7,138,119 |
| Tampa-St. Petersburg | FL | 70,231,526 |
| Winter Haven | FL | 5,468,493 |
| Pensacola | FL-AL | 8,754,287 |
| Atlanta | GA | 203,500,127 |
| Columbus, GA | GA | 7,725,933 |
| Savannah | GA | 9,029,164 |
| Augusta-Richmond County | GA-SC | 10,767,082 |
| Honolulu | HI | 47,183,465 |
| Des Moines | IA | 17,508,568 |
| Davenport | IA-IL | 9,900,256 |
| Boise City | ID | 12,769,041 |
| Peoria | IL | 7,813,821 |
| Rockford | IL | 7,964,631 |
| Chicago | IL-IN | 612,582,940 |
| Round Lake Beach-McHenry-Grayslake | IL-WI | 13,509,735 |
| Fort Wayne | IN | 9,888,997 |
| Indianapolis | IN | 46,513,085 |
| Evansville | IN-KY | 7,822,339 |
| South Bend | IN-MI | 12,329,071 |
| Wichita | KS | 14,627,524 |
| Lexington-Fayette | KY | 11,539,473 |
| Louisville/Jefferson County | KY-IN | 36,376,021 |
| Baton Rouge | LA | 18,943,791 |
| Lafayette | LA | 8,087,491 |
| New Orleans | LA | 39,641,306 |
| Shreveport | LA | 10,639,961 |
| Barnstable Town | MA | 11,776,798 |
| Springfield, MA | MA-CT | 22,755,744 |
| Worcester | MA-CT | 18,803,948 |
| Boston | MA-NH-RI | 335,082,492 |
| Aberdeen-Bel Air South-Bel Air North | MD | 6,481,740 |
| Baltimore | MD | 149,349,072 |
| Portland, ME | ME | 21,099,593 |
| Ann Arbor | MI | 11,805,898 |
| Detroit | MI | 103,607,766 |
| Flint | MI | 12,969,343 |
| Grand Rapids | MI | 18,362,052 |
| Kalamazoo | MI | 6,215,545 |
| Lansing | MI | 11,408,005 |
| Minneapolis-St. Paul | MN-WI | 113,800,764 |
| Springfield, MO | MO | 9,116,324 |
| St. Louis | MO-IL | 99,604,975 |
| Kansas City | MO-KS | 52,205,823 |
| Gulfport | MS | 7,657,399 |
| Jackson | MS | 11,250,727 |
| Asheville | NC | 6,922,934 |
| Concord, NC | NC | 5,400,539 |
| Durham | NC | 13,573,188 |
| Fayetteville | NC | 8,031,351 |
| Greensboro | NC | 10,416,480 |
| Hickory | NC | 5,309,651 |
| Raleigh | NC | 25,749,807 |
| Wilmington | NC | 6,257,729 |
| Winston-Salem | NC | 10,767,385 |
| Charlotte | NC-SC | 39,646,189 |
| Lincoln | NE | 9,166,606 |
| Omaha | NE-IA | 25,438,848 |
| Nashua | NH-MA | 5,706,220 |
| Atlantic City | NJ | 20,381,900 |
| Trenton | NJ | 26,025,244 |
| Albuquerque | NM | 42,678,603 |
| Las Vegas-Henderson | NV | 71,953,624 |
| Reno | NV-CA | 13,538,382 |
| Albany-Schenectady | NY | 19,904,171 |
| Buffalo | NY | 32,983,279 |
| Rochester | NY | 21,147,339 |
| Syracuse | NY | 12,573,475 |
| Poughkeepsie-Newburgh | NY-NJ | 32,521,807 |
| New York-Newark | NY-NJ-CT | 1,916,894,759 |
| Akron | OH | 17,100,930 |
| Canton | OH | 8,639,819 |
| Cleveland | OH | 70,880,738 |
| Columbus, OH | OH | 39,274,751 |
| Dayton | OH | 38,688,615 |
| Cincinnati | OH-KY-IN | 48,577,720 |
| Toledo | OH-MI | 15,224,689 |
| Youngstown | OH-PA | 10,907,397 |
| Oklahoma City | OK | 30,428,372 |
| Tulsa | OK | 23,607,908 |
| Eugene | OR | 11,335,624 |
| Salem | OR | 10,977,659 |
| Portland, OR | OR-WA | 95,096,643 |
| Harrisburg | PA | 17,075,070 |
| Lancaster | PA | 23,490,845 |
| Pittsburgh | PA | 83,825,043 |
| Reading | PA | 8,841,739 |
| Scranton | PA | 11,761,206 |
| York | PA | 7,568,950 |
| Allentown | PA-NJ | 21,427,657 |
| Philadelphia | PA-NJ-DE-MD | 383,895,301 |
| Providence | RI-MA | 69,972,775 |
| Charleston-North Charleston | SC | 17,933,620 |
| Columbia | SC | 16,372,586 |
| Greenville | SC | 11,875,636 |
| Myrtle Beach-Socastee | SC-NC | 6,445,739 |
| Knoxville | TN | 17,053,646 |
| Nashville-Davidson | TN | 43,550,696 |
| Chattanooga | TN-GA | 11,607,017 |
| Memphis | TN-MS-AR | 34,459,208 |
| Austin | TX | 57,008,519 |
| Brownsville | TX | 6,996,892 |
| Conroe-The Woodlands | TX | 8,632,892 |
| Corpus Christi | TX | 11,937,198 |
| Dallas-Fort Worth-Arlington | TX | 202,693,279 |
| Denton-Lewisville | TX | 13,293,955 |
| Houston | TX | 184,677,140 |
| Killeen | TX | 6,765,375 |
| Laredo | TX | 8,301,090 |
| Lubbock | TX | 8,210,135 |
| McAllen | TX | 20,775,048 |
| San Antonio | TX | 67,631,910 |
| El Paso | TX-NM | 31,682,150 |
| Ogden-Layton | UT | 22,039,139 |
| Provo-Orem | UT | 15,220,159 |
| Salt Lake City-West Valley City | UT | 50,619,306 |
| Richmond | VA | 30,651,495 |
| Roanoke | VA | 6,650,719 |
| Virginia Beach | VA | 47,686,071 |
| Kennewick-Pasco | WA | 11,760,512 |
| Seattle | WA | 203,708,894 |
| Spokane | WA | 14,349,980 |
| Appleton | WI | 7,087,751 |
| Green Bay | WI | 6,401,771 |
| Madison | WI | 16,775,448 |
| Milwaukee | WI | 48,847,836 |
| Huntington | WV-OH-KY | 8,058,339 |
Notes: Includes funding that is provided directly or suballocated to entities in urbanized areas.
This table shows the contract authority that would be available if the total authorization in FY2015 remained at the FY2014 level, with no changes in distribution formulas.
Urbanized areas (UZAs) are defined by the Census Bureau, and are based on population of a core urban cluster as well as density. Because density is a factor in UZA definitions, the boundaries do not necessarily follow state, MPO, MSA, or county boundaries. While each UZA must be represented by an MPO, the boundaries of the MPO do not necessarily match the UZA boundaries. Also, in some cases there is more than one MPO for a given UZA.
Sources: FHWA: “Fiscal Year 2014 Supplementary Tables, Tables 3 and 10.”
FTA: FY 2014 Apportionment Tables. (http://www.fta.dot.gov/12853_14875.html)
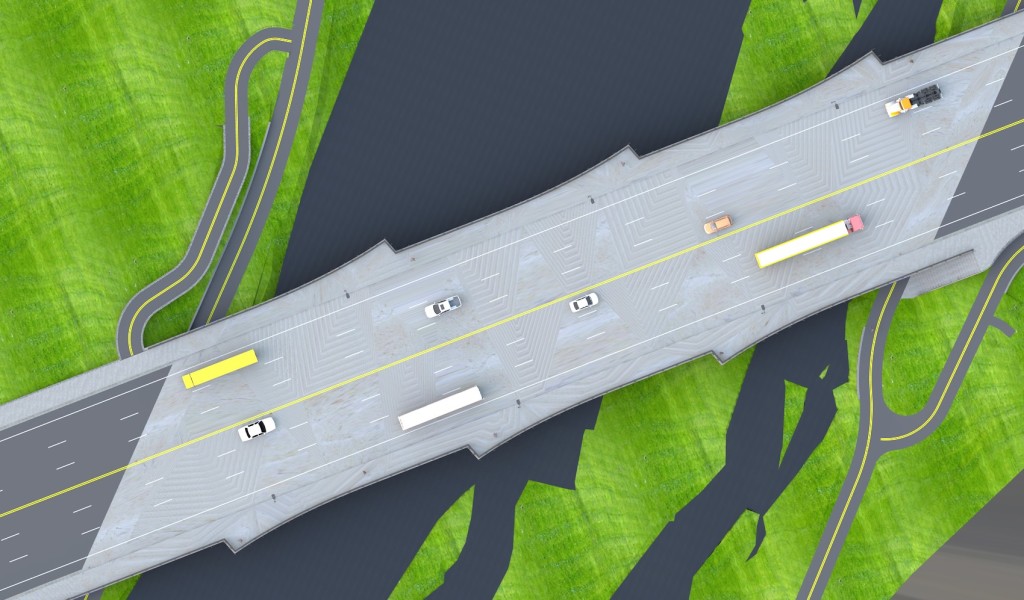
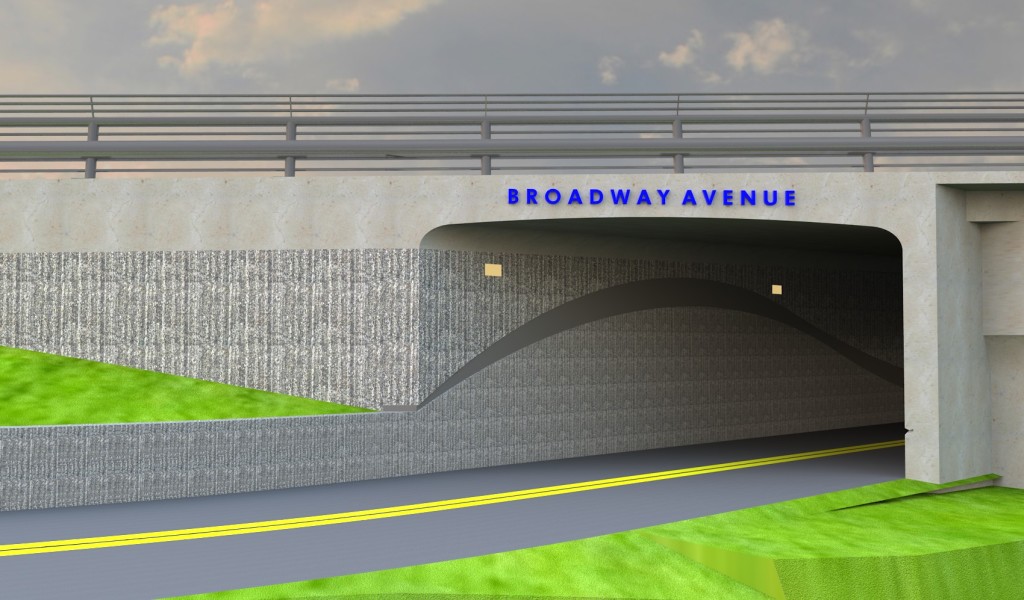
Bridge out ahead
Boise, Idaho
Federal share at risk: $10.4 million // Project cost: $11.2 million
Broadway Bridge in downtown Boise has the lowest structural rating of any bridge in the state. On game days at Boise State University, thousands of people crowd the narrow 4-foot sidewalks to cross the critical choke point for traffic in the area. Given its degraded condition, the bridge could require weight restrictions or closure at any time.
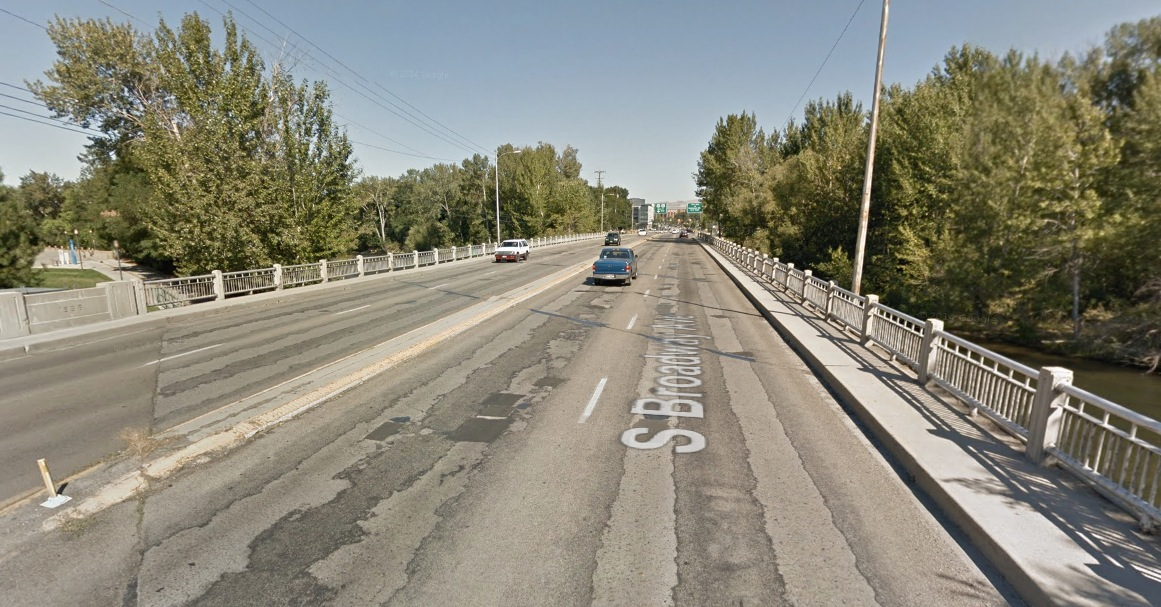
The Broadway Bridge replacement, scheduled for 2015, is one of few new construction projects in a state plan dedicated almost entirely to maintaining existing roads. The Idaho Transportation Department is partnering with the city of Boise on the design to ensure the new bridge serves the needs of city residents and will enhance the neighborhood. Sidewalks will be expanded to 10 feet and bicycle lanes will be added on the bridge and adjoining sections of Broadway Avenue and there will be new connections to the Greenbelt, a regional recreational trail that passes under the bridge.
Tennessee stops work on new projects
Because of uncertainty about future federal funding, the Tennessee Department of Transportation has halted engineering on new projects. TDOT Commissioner John Schroer reports that with a loss of federal dollars, the department would need to pare back its plan to work “exclusively on the maintenance of our existing pavement and bridges rather than new projects.” Limited funding could jeopardize projects that many regional leaders have planned to limit congestion and maintain quality of life as population booms.
Columbus, Ohio: Waiting on the bus
Columbus, OH, home to a major university and Ohio’s state government, is a growing region with a projected 22 percent growth in transit ridership this decade. To accommodate demand, the Central Ohio Transit Authority plans to add 29 new buses to its fleet in 2015, replacing some of its dilapidated buses and adding 12 buses to the peak-time fleet. New buses are critical to get residents across the region to work.
Residents in the region support transit service through a voter-approved local sales tax and the agency is using primarily local funds to rehab a garage to service the new buses, but the agency is planning for federal matching funds to purchase new buses. In addition to adding service on existing routes, COTA is planning the region’s first bus rapid transit corridor on Cleveland Avenue.
Passengers pack an existing COTA bus line in Columbus, Ohio.
Quad Cities, Illinois // I-74 bridge project
Quad Cities, Iowa/Illinois: A top priority back on the shelf

The I-74 bridges connecting Iowa and Illinois carry nearly half the traffic each day between the cities of this bi-state region where one of five workers crosses the river to go to work. The narrow, obsolete bridges date back to 1935 and were never designed to be part of an interstate highway system. This stretch of road sees more than three times as many crashes as comparable corridors and increased traffic on the bridge has created a critical bottleneck that also affects freight passing through the middle of the country on the national freight network. Replacing the I-74 bridges have been a top priority for regional leaders for the last two decades.
When Illinois and Iowa DOTs released a construction plan for coming years including more than $800 million programmed for the central bridge span, The Quad City Times editorialized that “The Quad-Cities’ biggest public construction project in history seems to suddenly move from planning to action.” Yet collapsing federal funding would threaten that progress. Illinois’ improvements on adjoining streets have begun and Iowa is scheduled to begin construction next year. Beyond just next year, though, the long-term funding uncertainty created by the insolvent trust fund jeopardizes the progress of the entire corridor project, which will depend on reliable federal contributions.

Transportation Secretary Anthony Foxx tours the existing I-74 bridge site with Representatives Cheri Bustos (IL-17) and Dave Loebsack (IA-2). Photo courtesy of Rep. Loebsack’s office.
Arkansas bears up under bad bridges, needed maintenance
Ten bridge replacement, road repair and highway expansion projects set to go forward this summer have been pulled by the Arkansas State Highway and Transportation Department because of uncertainty about federal reimbursement. Arkansas has nearly nine hundred structurally deficient bridges that carry a total of more than 1.5 million vehicles a day.